 Elo
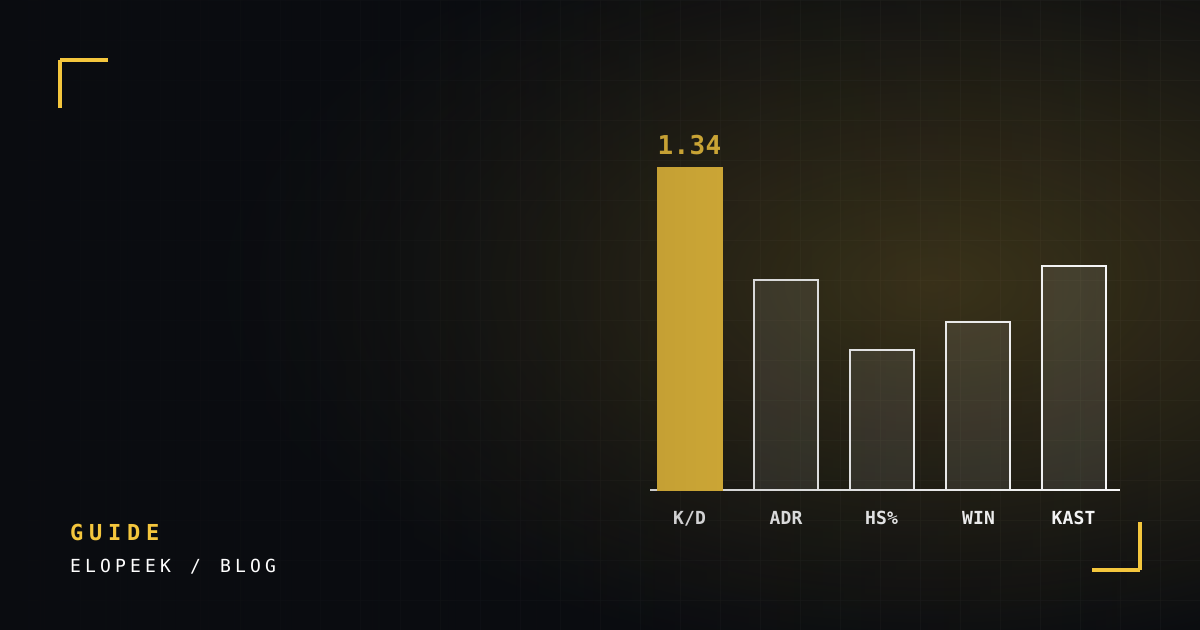
When you open a player's profile you see a list of numbers. Each one measures something different and none of them alone says "this player is good" or "bad". This article covers the most common CS2 stats and how to read them properly.
K/D (kill/death ratio)
K/D is a player's kills divided by their deaths. 1.00 is even; 1.20 and above is usually a strong performance.
What it doesn't tell you: K/D does not show when the kills happened. Kills after a round is already lost raise K/D but don't win matches. Support and entry players also naturally tend to have lower K/D.
Average kills
Average kills per match is a simple measure of impact. It depends on match length, though: a 16–14 game naturally produces more kills than a 13–3 game.
ADR (average damage per round)
ADR shows how much damage a player deals per round. Because it counts damage that didn't turn into kills, it can be fairer than K/D. An ADR of 80 or more is generally considered good.
HS% (headshot percentage)
The share of kills that were headshots. A high HS% can point to good aim but is not a skill measure on its own. AWPers naturally have low HS% because the AWP kills with body shots too.
Win rate
This is the stat that directly drives Elo. Watch the sample size: a 10-match win rate swings far more than a 100-match one. A window such as the last 20 matches gives a picture that is both current and reasonably reliable.
Reading stats together
| Pattern | Possible reading |
|---|---|
| High K/D, low win rate | Strong individually, but team contribution may be limited. |
| Low K/D, high win rate | Probably a support or entry player who plays for the team. |
| High ADR, average K/D | Deals a lot of damage but doesn't finish kills; creates space for teammates. |
| Low HS%, high K/D | Likely an AWPer. |
Why the form graph matters
Averages show a player's overall level but not their direction. A form graph shows whether they are trending up or down. A "volatile" graph means the player swings between very good and very bad games.
Summary
No single stat is enough. The clearest picture comes from reading several numbers together. EloPeek shows win rate, average K/D, average kills and a 20-match form graph side by side on each player card, turning that reading into a few seconds' work.